Recording Rules
Video Lecture


Description
Time series queries can quickly become quite complicated to remember and type using the Expression Browser in the default Prometheus User Interface.
Example query
100 - (100 * node_memory_MemFree_bytes / node_memory_MemTotal_bytes)
Rather than remembering and typing this query every time, we can create a recording rule that will run at a chosen interval and make the data available as a time series.
Recording Rule Example 1
CD into the /usr/local/bin/prometheus folder
cd /etc/prometheus
Create a new file called prometheus_rules.yml
sudo nano prometheus_rules.yml
Add our test expression as a recording rule
groups:
- name: custom_rules
rules:
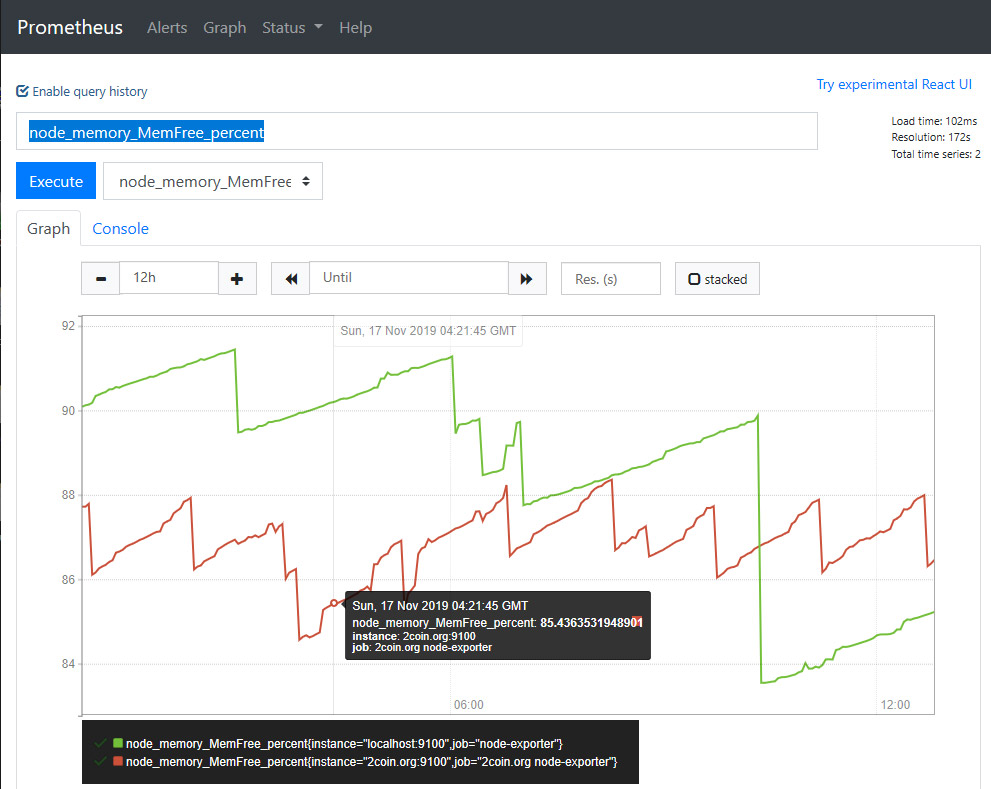
- record: node_memory_MemFree_percent
expr: 100 - (100 * node_memory_MemFree_bytes / node_memory_MemTotal_bytes)
Save it, and we can now verify the syntax is ok.
Prometheus now comes with a tool called Promtool which you can use to check your rules files and other things.
We will check our rules file is ok.
promtool check rules prometheus_rules.yml
The response should contain SUCCESS otherwise there was a problem with your prometheus_rules.yml file.
Now let's add the prometheus_rules.yml reference to the prometheus.yml rule_files section.
rule_files:
  - "prometheus_rules.yml"
And restart the Prometheus service.
sudo service prometheus restart
sudo service prometheus status
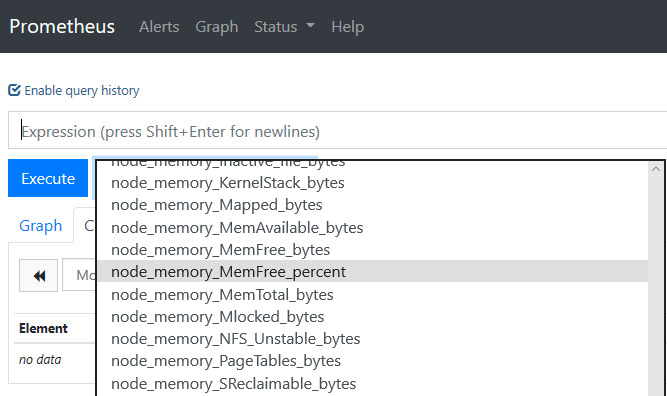
Refresh the Prometheus user interface and check the dropdown
Recording Rule Example 2
Let's do another more complicated example.
Update our prometheus_rules.yml file with,
groups:
- name: custom_rules
rules:
- record: node_memory_MemFree_percent
expr: 100 - (100 * node_memory_MemFree_bytes / node_memory_MemTotal_bytes)
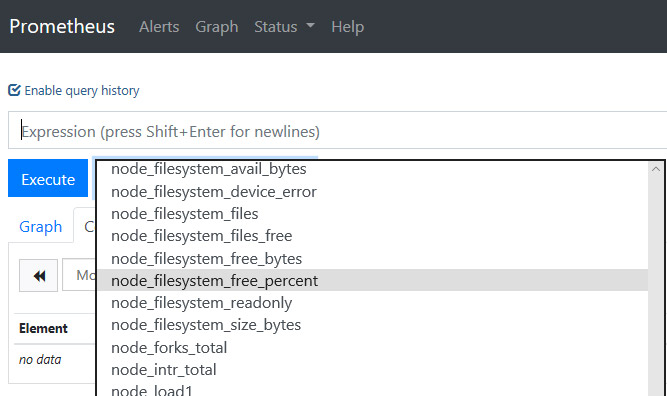
- record: node_filesystem_free_percent
expr: 100 * node_filesystem_free_bytes{mountpoint="/"} / node_filesystem_size_bytes{mountpoint="/"}
Check it with the promtool
promtool check rules prometheus_rules.yml
If all is ok, restart the Prometheus service.
sudo service prometheus restart
sudo service prometheus status
Refresh the Prometheus user interface and check the drop-down.
Useful Links
Prometheus 2.31 and Ubuntu 22.04 Notes
There are no considerable differences to be aware of as shown and discussed in the video in case you decide to install Prometheus 2.31.2 on Ubuntu 22.04 LTS.