Grafana 6 : Create a Cisco Switch Dashboard with the InfluxDB 1.9/Telegraf Data Source
Video Lecture

Description
Note
This lesson was from a previous version of my course, which I've now made this video available to view for free.
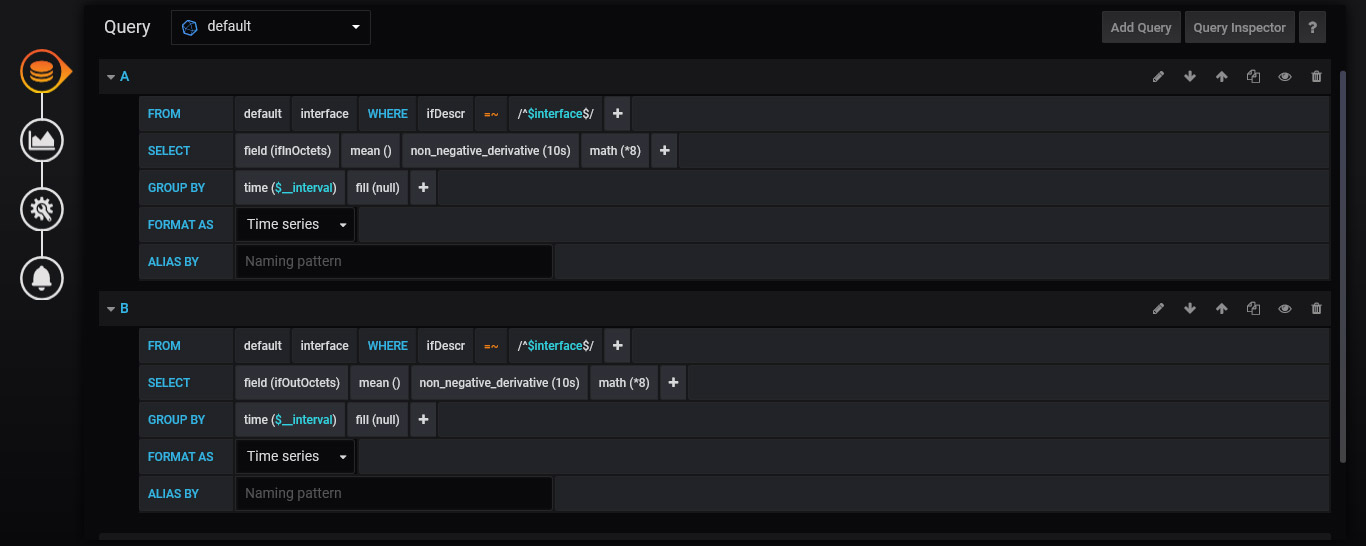
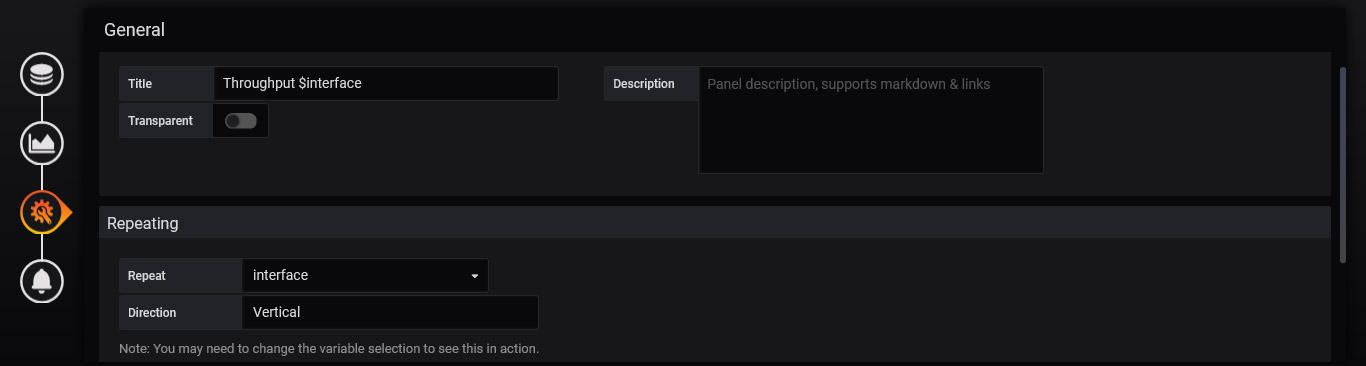
In this example, my switch is on an internal network and I create a Dashboard using the InfluxDB data source, showing throughput of all its interfaces,
On my internal network, I created a port forwarding rule to allow the external Telegraf agent, running on my Grafana Server in the cloud, to query SNMP.
The SNMP protocol uses UDP and port 161 by default.
My Switch is a Cisco 2950, connected and working on my internal network.
It has,
- SNMP enabled,
- A community named to "external",
- An ACL set to only allow the IP of my Grafana server for the "external" community,
- The default gateway set to the IP address of my main network router that also has internet access.
Configure Telegraf
On the Grafana Server,
sudo nano /etc/telegraf/telegraf.conf
Add this below to your inputs section. But change the agents value to the external IP of your network, and change the community to the community set on your SNMP router/switch/device.
[[inputs.snmp]]
  agents = [ "XXX.XXX.XXX.XXX:161" ]
  version = 2
  community = "mycommunity"

  [[inputs.snmp.field]]
    name = "hostname"
    oid = "RFC1213-MIB::sysName.0"
    is_tag = true

  [[inputs.snmp.field]]
    name = "uptime"
    oid = "DISMAN-EXPRESSION-MIB::sysUpTimeInstance"

  # IF-MIB::ifTable contains counters on input and output traffic as well as errors and discards.
  [[inputs.snmp.table]]
    name = "interface"
    inherit_tags = [ "hostname" ]
    oid = "IF-MIB::ifTable"

    # Interface tag - used to identify interface in metrics database
    [[inputs.snmp.table.field]]
      name = "ifDescr"
      oid = "IF-MIB::ifDescr"
      is_tag = true

  # IF-MIB::ifXTable contains newer High Capacity (HC) counters that do not overflow as fast for a few of the ifTable counters
  [[inputs.snmp.table]]
    name = "interface"
    inherit_tags = [ "hostname" ]
    oid = "IF-MIB::ifXTable"

    # Interface tag - used to identify interface in metrics database
    [[inputs.snmp.table.field]]
      name = "ifDescr"
      oid = "IF-MIB::ifDescr"
      is_tag = true

  # EtherLike-MIB::dot3StatsTable contains detailed ethernet-level information about what kind of errors have been logged on an interface (such as FCS error, frame too long, etc)
  [[inputs.snmp.table]]
    name = "interface"
    inherit_tags = [ "hostname" ]
    oid = "EtherLike-MIB::dot3StatsTable"

    # Interface tag - used to identify interface in metrics database
    [[inputs.snmp.table.field]]
      name = "ifDescr"
      oid = "IF-MIB::ifDescr"
      is_tag = true
Restart and check status.
sudo service telegraf restart
sudo service telegraf status
Now create the dashboard.
Dashboard Variable
| Key | Value |
|---|---|
| Name | interface |
| Type | Query |
| Data Source | InfluxDB |
| Query | SHOW TAG VALUES from "interface" with key = "ifDescr" |
| Regex | /Vlan|FastEthernet/ |
| Multi Value | True |
| Include All | True |
Graph Settings