Create a Cisco Switch Dashboard with the Zabbix Data Source
Video Lecture

Description
Note
This is an old video that I now provide for free. It was created using Grafana 5 and Zabbix 5 LTS. Despite the video being quite old, it still contains useful information that can be applied to modern Grafana and Zabbix.
The Zabbix data source updates automatically on any changes to hosts configured on the Zabbix server, so after adding the Cisco Switch to my Zabbix server as a SNMP host, I am immediately able to create a Dashboard of the Data and display it inside Grafana.
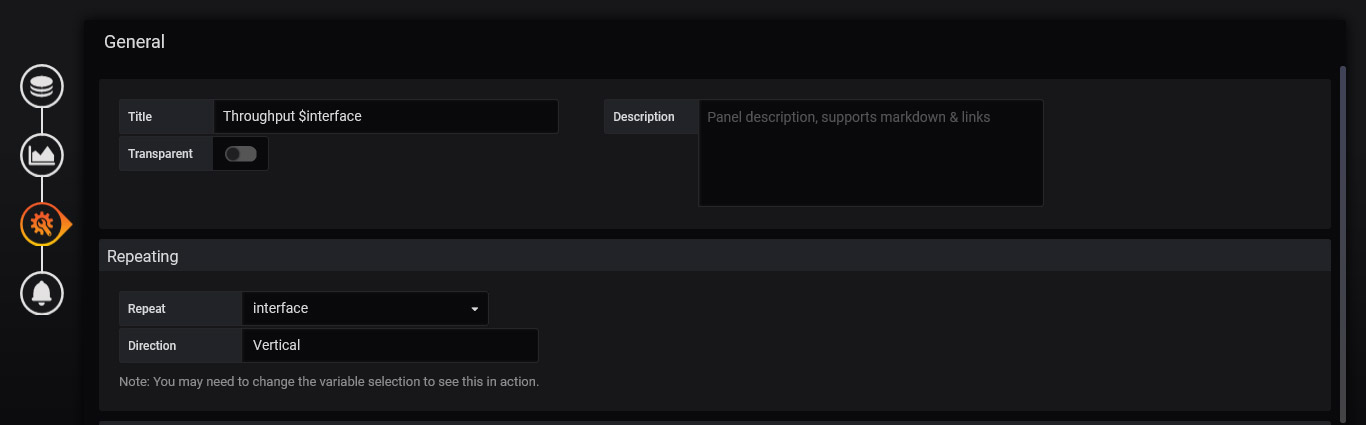
Dashboard Variable
| Key | Value |
|---|---|
| Name | interface |
| Type | Query |
| Data Source | Zabbix |
| Query | Templates/Network devices.Switch./Interface*/ |
| Multi Value | True |
| Include All | True |
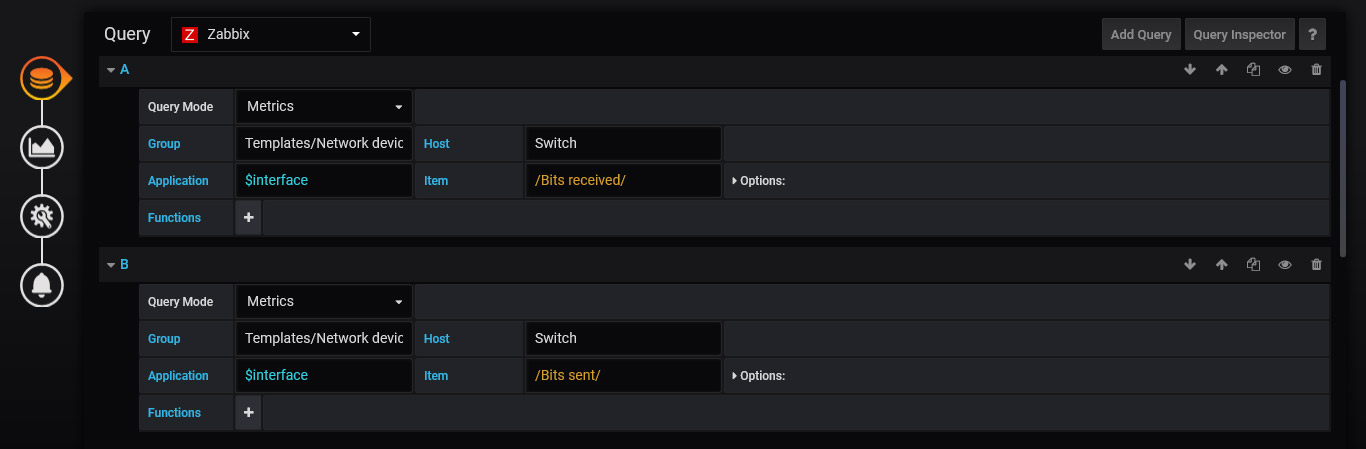
Graph
Zabbix Course
If you want to try a more detailed course on Zabbix, then you can visit my Zabbix tutorials.