Create A Dashboard For Linux System Metrics
Video Lecture


Description
Now that we have a System dashboard visible in InfluxDB, we can also re-produce this same dashboard in Grafana.
In this video, I demonstrate the process of doing that.
The full dashboard JSON that you can import into Grafana is below.
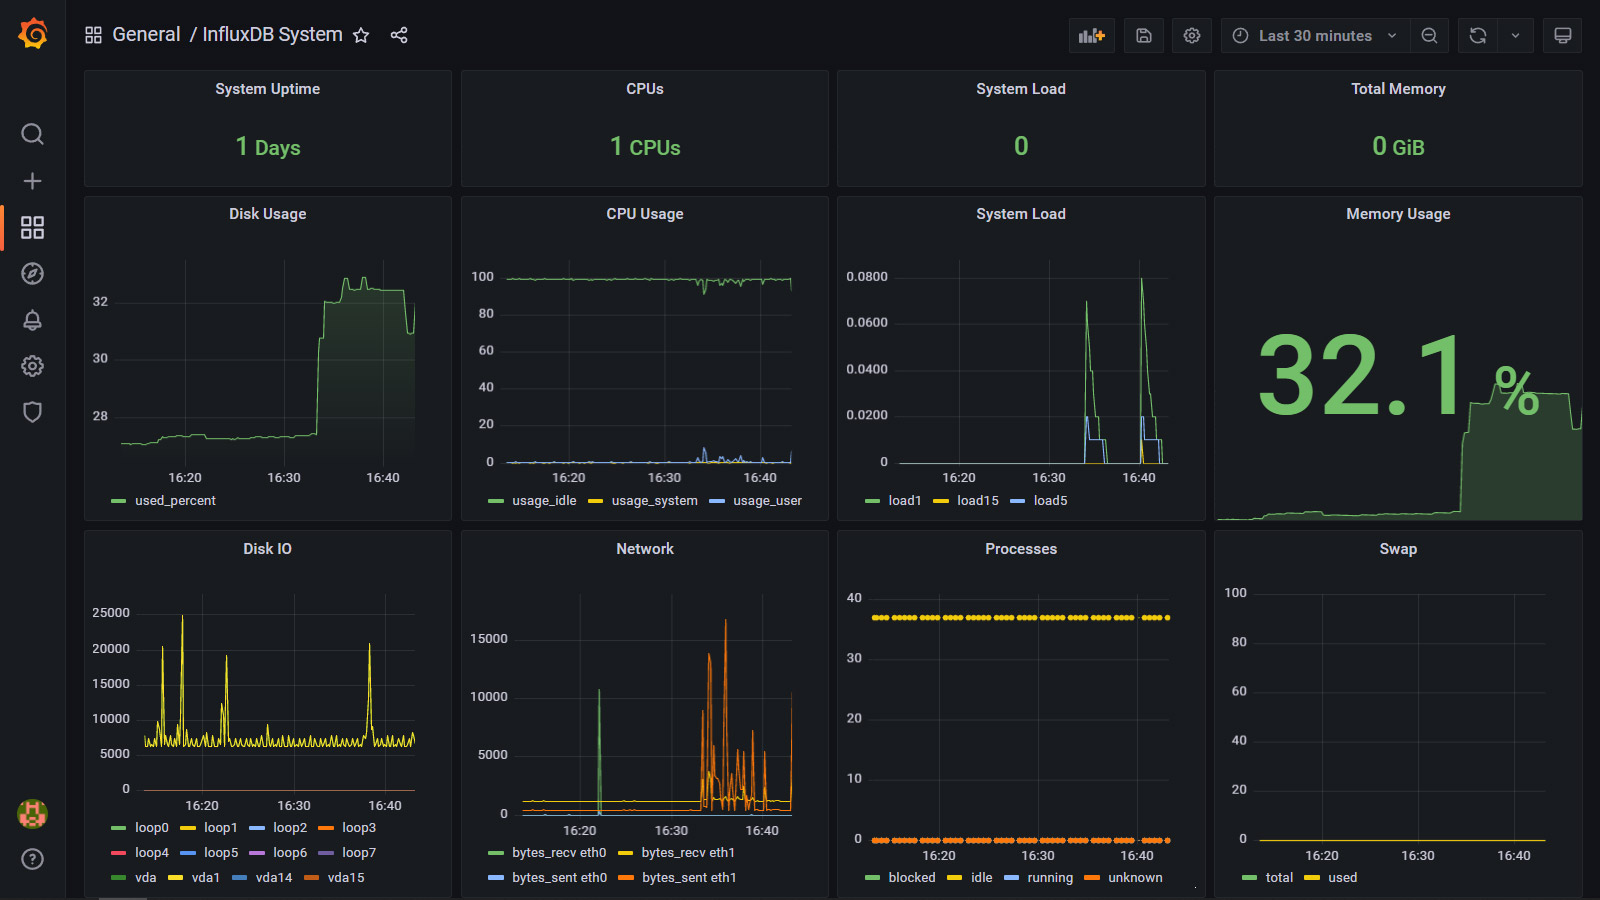
InfluxDB System Dashboard JSON
Updated for Grafana 10.0.0 and InfluxDB 2.7.1
{
"annotations": {
"list": [
{
"builtIn": 1,
"datasource": {
"type": "datasource",
"uid": "grafana"
},
"enable": true,
"hide": true,
"iconColor": "rgba(0, 211, 255, 1)",
"name": "Annotations & Alerts",
"target": {
"limit": 100,
"matchAny": false,
"tags": [],
"type": "dashboard"
},
"type": "dashboard"
}
]
},
"editable": true,
"fiscalYearStartMonth": 0,
"graphTooltip": 0,
"id": 17,
"links": [],
"liveNow": false,
"panels": [
{
"datasource": {
"type": "influxdb",
"uid": "a9d0fa68-f307-48dc-a1f1-4d6358dec239"
},
"description": "",
"fieldConfig": {
"defaults": {
"color": {
"mode": "thresholds"
},
"decimals": 2,
"mappings": [],
"thresholds": {
"mode": "absolute",
"steps": [
{
"color": "green",
"value": null
},
{
"color": "red",
"value": 80
}
]
},
"unit": "Days"
},
"overrides": []
},
"gridPos": {
"h": 4,
"w": 6,
"x": 0,
"y": 0
},
"id": 2,
"options": {
"colorMode": "value",
"graphMode": "area",
"justifyMode": "auto",
"orientation": "auto",
"reduceOptions": {
"calcs": ["lastNotNull"],
"fields": "",
"values": false
},
"text": {},
"textMode": "auto"
},
"pluginVersion": "10.0.0",
"targets": [
{
"datasource": {
"type": "influxdb",
"uid": "a9d0fa68-f307-48dc-a1f1-4d6358dec239"
},
"query": "from(bucket: \"telegraf\")\r\n |> range(start: v.timeRangeStart, stop: v.timeRangeStop)\r\n |> filter(fn: (r) => r._measurement == \"system\")\r\n |> filter(fn: (r) => r._field == \"uptime\")\r\n |> filter(fn: (r) => r.host == \"${Host}\")\r\n |> last()\r\n |> map(fn: (r) => ({ _value: float(v: r._value) / 86400.00 }))",
"refId": "A"
}
],
"title": "System Uptime",
"type": "stat"
},
{
"datasource": {
"type": "influxdb",
"uid": "a9d0fa68-f307-48dc-a1f1-4d6358dec239"
},
"description": "",
"fieldConfig": {
"defaults": {
"color": {
"mode": "thresholds"
},
"mappings": [],
"thresholds": {
"mode": "absolute",
"steps": [
{
"color": "green",
"value": null
},
{
"color": "red",
"value": 80
}
]
},
"unit": "CPUs"
},
"overrides": []
},
"gridPos": {
"h": 4,
"w": 6,
"x": 6,
"y": 0
},
"id": 4,
"options": {
"colorMode": "value",
"graphMode": "area",
"justifyMode": "auto",
"orientation": "auto",
"reduceOptions": {
"calcs": ["lastNotNull"],
"fields": "",
"values": false
},
"text": {},
"textMode": "auto"
},
"pluginVersion": "10.0.0",
"targets": [
{
"datasource": {
"type": "influxdb",
"uid": "a9d0fa68-f307-48dc-a1f1-4d6358dec239"
},
"query": "from(bucket: \"telegraf\")\r\n |> range(start: v.timeRangeStart)\r\n |> filter(fn: (r) => r._measurement == \"system\")\r\n |> filter(fn: (r) => r._field == \"n_cpus\")\r\n |> filter(fn: (r) => r.host == \"${Host}\")\r\n |> last()",
"refId": "A"
}
],
"title": "CPUs",
"type": "stat"
},
{
"datasource": {
"type": "influxdb",
"uid": "a9d0fa68-f307-48dc-a1f1-4d6358dec239"
},
"description": "",
"fieldConfig": {
"defaults": {
"color": {
"mode": "thresholds"
},
"decimals": 2,
"mappings": [],
"thresholds": {
"mode": "absolute",
"steps": [
{
"color": "green",
"value": null
},
{
"color": "red",
"value": 80
}
]
}
},
"overrides": []
},
"gridPos": {
"h": 4,
"w": 6,
"x": 12,
"y": 0
},
"id": 6,
"options": {
"colorMode": "value",
"graphMode": "area",
"justifyMode": "auto",
"orientation": "auto",
"reduceOptions": {
"calcs": ["lastNotNull"],
"fields": "",
"values": false
},
"text": {},
"textMode": "auto"
},
"pluginVersion": "10.0.0",
"targets": [
{
"datasource": {
"type": "influxdb",
"uid": "a9d0fa68-f307-48dc-a1f1-4d6358dec239"
},
"query": "from(bucket: \"telegraf\")\r\n |> range(start: v.timeRangeStart, stop: v.timeRangeStop)\r\n |> filter(fn: (r) => r._measurement == \"system\")\r\n |> filter(fn: (r) => r._field == \"load1\")\r\n |> filter(fn: (r) => r.host == \"${Host}\")\r\n |> last()",
"refId": "A"
}
],
"title": "System Load",
"type": "stat"
},
{
"datasource": {
"type": "influxdb",
"uid": "a9d0fa68-f307-48dc-a1f1-4d6358dec239"
},
"description": "",
"fieldConfig": {
"defaults": {
"color": {
"mode": "thresholds"
},
"mappings": [],
"thresholds": {
"mode": "absolute",
"steps": [
{
"color": "green",
"value": null
},
{
"color": "red",
"value": 80
}
]
},
"unit": "gbytes"
},
"overrides": []
},
"gridPos": {
"h": 4,
"w": 6,
"x": 18,
"y": 0
},
"id": 8,
"options": {
"colorMode": "value",
"graphMode": "area",
"justifyMode": "auto",
"orientation": "auto",
"reduceOptions": {
"calcs": ["lastNotNull"],
"fields": "",
"values": false
},
"text": {},
"textMode": "auto"
},
"pluginVersion": "10.0.0",
"targets": [
{
"datasource": {
"type": "influxdb",
"uid": "a9d0fa68-f307-48dc-a1f1-4d6358dec239"
},
"query": "from(bucket: \"telegraf\")\r\n |> range(start: v.timeRangeStart, stop: v.timeRangeStop)\r\n |> filter(fn: (r) => r._measurement == \"mem\") \r\n |> filter(fn: (r) => r._field == \"total\")\r\n |> filter(fn: (r) => r.host == \"${Host}\")\r\n |> last() \r\n |> map(fn: (r) => ({r with _value: float(v: r._value) / 1024.0 / 1024.0 / 1024.0}))",
"refId": "A"
}
],
"title": "Total Memory",
"type": "stat"
},
{
"datasource": {
"type": "influxdb",
"uid": "a9d0fa68-f307-48dc-a1f1-4d6358dec239"
},
"description": "",
"fieldConfig": {
"defaults": {
"color": {
"mode": "palette-classic"
},
"custom": {
"axisCenteredZero": false,
"axisColorMode": "text",
"axisLabel": "",
"axisPlacement": "auto",
"barAlignment": 0,
"drawStyle": "line",
"fillOpacity": 19,
"gradientMode": "opacity",
"hideFrom": {
"legend": false,
"tooltip": false,
"viz": false
},
"lineInterpolation": "linear",
"lineStyle": {
"fill": "solid"
},
"lineWidth": 1,
"pointSize": 5,
"scaleDistribution": {
"type": "linear"
},
"showPoints": "auto",
"spanNulls": false,
"stacking": {
"group": "A",
"mode": "none"
},
"thresholdsStyle": {
"mode": "off"
}
},
"mappings": [],
"thresholds": {
"mode": "absolute",
"steps": [
{
"color": "green",
"value": null
},
{
"color": "red",
"value": 80
}
]
}
},
"overrides": []
},
"gridPos": {
"h": 9,
"w": 6,
"x": 0,
"y": 4
},
"id": 12,
"options": {
"legend": {
"calcs": [],
"displayMode": "list",
"placement": "bottom",
"showLegend": true
},
"tooltip": {
"mode": "single",
"sort": "none"
}
},
"targets": [
{
"datasource": {
"type": "influxdb",
"uid": "a9d0fa68-f307-48dc-a1f1-4d6358dec239"
},
"query": "from(bucket: \"telegraf\")\r\n |> range(start: v.timeRangeStart, stop: v.timeRangeStop)\r\n |> filter(fn: (r) => r._measurement == \"disk\")\r\n |> filter(fn: (r) => r._field == \"used_percent\")\r\n |> filter(fn: (r) => r.host == \"${Host}\")\r\n |> aggregateWindow(every: v.windowPeriod, fn: mean, createEmpty: false)",
"refId": "A"
}
],
"title": "Disk Usage",
"type": "timeseries"
},
{
"datasource": {
"type": "influxdb",
"uid": "a9d0fa68-f307-48dc-a1f1-4d6358dec239"
},
"description": "",
"fieldConfig": {
"defaults": {
"color": {
"mode": "palette-classic"
},
"custom": {
"axisCenteredZero": false,
"axisColorMode": "text",
"axisLabel": "",
"axisPlacement": "auto",
"barAlignment": 0,
"drawStyle": "line",
"fillOpacity": 0,
"gradientMode": "opacity",
"hideFrom": {
"legend": false,
"tooltip": false,
"viz": false
},
"lineInterpolation": "linear",
"lineWidth": 1,
"pointSize": 5,
"scaleDistribution": {
"type": "linear"
},
"showPoints": "auto",
"spanNulls": false,
"stacking": {
"group": "A",
"mode": "none"
},
"thresholdsStyle": {
"mode": "off"
}
},
"mappings": [],
"thresholds": {
"mode": "absolute",
"steps": [
{
"color": "green",
"value": null
},
{
"color": "red",
"value": 80
}
]
}
},
"overrides": []
},
"gridPos": {
"h": 9,
"w": 6,
"x": 6,
"y": 4
},
"id": 14,
"options": {
"legend": {
"calcs": [],
"displayMode": "list",
"placement": "bottom",
"showLegend": true
},
"tooltip": {
"mode": "single",
"sort": "none"
}
},
"targets": [
{
"datasource": {
"type": "influxdb",
"uid": "a9d0fa68-f307-48dc-a1f1-4d6358dec239"
},
"query": "from(bucket: \"telegraf\")\r\n |> range(start: v.timeRangeStart, stop: v.timeRangeStop)\r\n |> filter(fn: (r) => r._measurement == \"cpu\")\r\n |> filter(fn: (r) => r._field == \"usage_user\" or r._field == \"usage_system\" or r._field == \"usage_idle\")\r\n |> filter(fn: (r) => r.cpu == \"cpu-total\")\r\n |> filter(fn: (r) => r.host == \"${Host}\")\r\n |> aggregateWindow(every: v.windowPeriod, fn: mean, createEmpty: false)\r\n |> map(fn: (r) => ({_value:r._value, _time:r._time, _field:r._field}))\r\n",
"refId": "A"
}
],
"title": "CPU Usage",
"type": "timeseries"
},
{
"datasource": {
"type": "influxdb",
"uid": "a9d0fa68-f307-48dc-a1f1-4d6358dec239"
},
"description": "",
"fieldConfig": {
"defaults": {
"color": {
"mode": "palette-classic"
},
"custom": {
"axisCenteredZero": false,
"axisColorMode": "text",
"axisLabel": "",
"axisPlacement": "auto",
"barAlignment": 0,
"drawStyle": "line",
"fillOpacity": 0,
"gradientMode": "none",
"hideFrom": {
"legend": false,
"tooltip": false,
"viz": false
},
"lineInterpolation": "linear",
"lineWidth": 1,
"pointSize": 5,
"scaleDistribution": {
"type": "linear"
},
"showPoints": "auto",
"spanNulls": false,
"stacking": {
"group": "A",
"mode": "none"
},
"thresholdsStyle": {
"mode": "off"
}
},
"mappings": [],
"thresholds": {
"mode": "absolute",
"steps": [
{
"color": "green",
"value": null
},
{
"color": "red",
"value": 80
}
]
}
},
"overrides": []
},
"gridPos": {
"h": 9,
"w": 6,
"x": 12,
"y": 4
},
"id": 16,
"options": {
"legend": {
"calcs": [],
"displayMode": "list",
"placement": "bottom",
"showLegend": true
},
"tooltip": {
"mode": "single",
"sort": "none"
}
},
"targets": [
{
"datasource": {
"type": "influxdb",
"uid": "a9d0fa68-f307-48dc-a1f1-4d6358dec239"
},
"query": "from(bucket: \"telegraf\")\r\n |> range(start: v.timeRangeStart, stop: v.timeRangeStop)\r\n |> filter(fn: (r) => r._measurement == \"system\")\r\n |> filter(fn: (r) => r._field == \"load1\" or r._field == \"load5\" or r._field == \"load15\")\r\n |> filter(fn: (r) => r.host == \"${Host}\")\r\n |> aggregateWindow(every: v.windowPeriod, fn: mean, createEmpty: false)\r\n |> map(fn: (r) => ({_value:r._value, _time:r._time, _field:r._field}))",
"refId": "A"
}
],
"title": "System Load",
"type": "timeseries"
},
{
"datasource": {
"type": "influxdb",
"uid": "a9d0fa68-f307-48dc-a1f1-4d6358dec239"
},
"description": "",
"fieldConfig": {
"defaults": {
"color": {
"mode": "palette-classic"
},
"mappings": [],
"thresholds": {
"mode": "absolute",
"steps": [
{
"color": "green",
"value": null
},
{
"color": "red",
"value": 80
}
]
},
"unit": "%"
},
"overrides": []
},
"gridPos": {
"h": 9,
"w": 6,
"x": 18,
"y": 4
},
"id": 10,
"options": {
"colorMode": "value",
"graphMode": "area",
"justifyMode": "auto",
"orientation": "auto",
"reduceOptions": {
"calcs": ["lastNotNull"],
"fields": "",
"values": false
},
"text": {},
"textMode": "auto"
},
"pluginVersion": "10.0.0",
"targets": [
{
"datasource": {
"type": "influxdb",
"uid": "a9d0fa68-f307-48dc-a1f1-4d6358dec239"
},
"query": "from(bucket: \"telegraf\")\r\n |> range(start: v.timeRangeStart)\r\n |> filter(fn: (r) => r._measurement == \"mem\")\r\n |> filter(fn: (r) => r._field == \"used_percent\")\r\n |> aggregateWindow(every: v.windowPeriod, fn: mean, createEmpty: false)\r\n |> yield(name: \"mean\")",
"refId": "A"
}
],
"title": "Memory Usage",
"type": "stat"
},
{
"datasource": {
"type": "influxdb",
"uid": "a9d0fa68-f307-48dc-a1f1-4d6358dec239"
},
"description": "",
"fieldConfig": {
"defaults": {
"color": {
"mode": "palette-classic"
},
"custom": {
"axisCenteredZero": false,
"axisColorMode": "text",
"axisLabel": "",
"axisPlacement": "auto",
"barAlignment": 0,
"drawStyle": "line",
"fillOpacity": 0,
"gradientMode": "none",
"hideFrom": {
"legend": false,
"tooltip": false,
"viz": false
},
"lineInterpolation": "linear",
"lineWidth": 1,
"pointSize": 5,
"scaleDistribution": {
"type": "linear"
},
"showPoints": "auto",
"spanNulls": false,
"stacking": {
"group": "A",
"mode": "none"
},
"thresholdsStyle": {
"mode": "off"
}
},
"mappings": [],
"thresholds": {
"mode": "absolute",
"steps": [
{
"color": "green",
"value": null
},
{
"color": "red",
"value": 80
}
]
}
},
"overrides": []
},
"gridPos": {
"h": 9,
"w": 6,
"x": 0,
"y": 13
},
"id": 18,
"options": {
"legend": {
"calcs": [],
"displayMode": "list",
"placement": "bottom",
"showLegend": true
},
"tooltip": {
"mode": "single",
"sort": "none"
}
},
"targets": [
{
"datasource": {
"type": "influxdb",
"uid": "a9d0fa68-f307-48dc-a1f1-4d6358dec239"
},
"query": "from(bucket: \"telegraf\")\r\n |> range(start: v.timeRangeStart, stop: v.timeRangeStop)\r\n |> filter(fn: (r) => r._measurement == \"diskio\")\r\n |> filter(fn: (r) => r._field == \"read_bytes\" or r._field == \"write_bytes\")\r\n |> filter(fn: (r) => r.host == \"${Host}\")\r\n |> derivative(unit: v.windowPeriod, nonNegative: false)\r\n |> map(fn: (r) => ({_value:r._value, _time:r._time, _field:r.name}))",
"refId": "A"
}
],
"title": "Disk IO",
"type": "timeseries"
},
{
"datasource": {
"type": "influxdb",
"uid": "a9d0fa68-f307-48dc-a1f1-4d6358dec239"
},
"description": "",
"fieldConfig": {
"defaults": {
"color": {
"mode": "palette-classic"
},
"custom": {
"axisCenteredZero": false,
"axisColorMode": "text",
"axisLabel": "",
"axisPlacement": "auto",
"barAlignment": 0,
"drawStyle": "line",
"fillOpacity": 0,
"gradientMode": "none",
"hideFrom": {
"legend": false,
"tooltip": false,
"viz": false
},
"lineInterpolation": "linear",
"lineWidth": 1,
"pointSize": 5,
"scaleDistribution": {
"type": "linear"
},
"showPoints": "auto",
"spanNulls": false,
"stacking": {
"group": "A",
"mode": "none"
},
"thresholdsStyle": {
"mode": "off"
}
},
"mappings": [],
"thresholds": {
"mode": "absolute",
"steps": [
{
"color": "green",
"value": null
},
{
"color": "red",
"value": 80
}
]
}
},
"overrides": []
},
"gridPos": {
"h": 9,
"w": 6,
"x": 6,
"y": 13
},
"id": 20,
"options": {
"legend": {
"calcs": [],
"displayMode": "list",
"placement": "bottom",
"showLegend": true
},
"tooltip": {
"mode": "single",
"sort": "none"
}
},
"targets": [
{
"datasource": {
"type": "influxdb",
"uid": "a9d0fa68-f307-48dc-a1f1-4d6358dec239"
},
"query": "from(bucket: \"telegraf\")\r\n |> range(start: v.timeRangeStart, stop: v.timeRangeStop)\r\n |> filter(fn: (r) => r._measurement == \"net\")\r\n |> filter(fn: (r) => r._field == \"bytes_recv\" or r._field == \"bytes_sent\")\r\n |> filter(fn: (r) => r.host == \"${Host}\")\r\n |> derivative(unit: v.windowPeriod, nonNegative: false)\r\n |> map(fn: (r) => ({_value:r._value, _time:r._time, _field:r._field, interface:r.interface}))",
"refId": "A"
}
],
"title": "Network",
"type": "timeseries"
},
{
"datasource": {
"type": "influxdb",
"uid": "a9d0fa68-f307-48dc-a1f1-4d6358dec239"
},
"description": "",
"fieldConfig": {
"defaults": {
"color": {
"mode": "palette-classic"
},
"custom": {
"axisCenteredZero": false,
"axisColorMode": "text",
"axisLabel": "",
"axisPlacement": "auto",
"barAlignment": 0,
"drawStyle": "line",
"fillOpacity": 0,
"gradientMode": "none",
"hideFrom": {
"legend": false,
"tooltip": false,
"viz": false
},
"lineInterpolation": "linear",
"lineWidth": 1,
"pointSize": 5,
"scaleDistribution": {
"type": "linear"
},
"showPoints": "auto",
"spanNulls": false,
"stacking": {
"group": "A",
"mode": "none"
},
"thresholdsStyle": {
"mode": "off"
}
},
"mappings": [],
"thresholds": {
"mode": "absolute",
"steps": [
{
"color": "green",
"value": null
},
{
"color": "red",
"value": 80
}
]
}
},
"overrides": []
},
"gridPos": {
"h": 9,
"w": 6,
"x": 12,
"y": 13
},
"id": 21,
"options": {
"legend": {
"calcs": [],
"displayMode": "list",
"placement": "bottom",
"showLegend": true
},
"tooltip": {
"mode": "single",
"sort": "none"
}
},
"targets": [
{
"datasource": {
"type": "influxdb",
"uid": "a9d0fa68-f307-48dc-a1f1-4d6358dec239"
},
"query": "from(bucket: \"telegraf\")\r\n |> range(start: v.timeRangeStart, stop: v.timeRangeStop)\r\n |> filter(fn: (r) => r._measurement == \"processes\")\r\n |> filter(fn: (r) => r._field == \"running\" or r._field == \"blocked\" or r._field == \"idle\" or r._field == \"unknown\")\r\n |> filter(fn: (r) => r.host == \"${Host}\")\r\n |> aggregateWindow(every: v.windowPeriod, fn: max)\r\n |> map(fn: (r) => ({_value:r._value, _time:r._time, _field:r._field}))",
"refId": "A"
}
],
"title": "Processes",
"type": "timeseries"
},
{
"datasource": {
"type": "influxdb",
"uid": "a9d0fa68-f307-48dc-a1f1-4d6358dec239"
},
"description": "",
"fieldConfig": {
"defaults": {
"color": {
"mode": "palette-classic"
},
"custom": {
"axisCenteredZero": false,
"axisColorMode": "text",
"axisLabel": "",
"axisPlacement": "auto",
"barAlignment": 0,
"drawStyle": "line",
"fillOpacity": 0,
"gradientMode": "none",
"hideFrom": {
"legend": false,
"tooltip": false,
"viz": false
},
"lineInterpolation": "linear",
"lineWidth": 1,
"pointSize": 5,
"scaleDistribution": {
"type": "linear"
},
"showPoints": "auto",
"spanNulls": false,
"stacking": {
"group": "A",
"mode": "none"
},
"thresholdsStyle": {
"mode": "off"
}
},
"mappings": [],
"thresholds": {
"mode": "absolute",
"steps": [
{
"color": "green",
"value": null
},
{
"color": "red",
"value": 80
}
]
}
},
"overrides": []
},
"gridPos": {
"h": 9,
"w": 6,
"x": 18,
"y": 13
},
"id": 22,
"options": {
"legend": {
"calcs": [],
"displayMode": "list",
"placement": "bottom",
"showLegend": true
},
"tooltip": {
"mode": "single",
"sort": "none"
}
},
"targets": [
{
"datasource": {
"type": "influxdb",
"uid": "a9d0fa68-f307-48dc-a1f1-4d6358dec239"
},
"query": "from(bucket: \"telegraf\")\r\n |> range(start: v.timeRangeStart, stop: v.timeRangeStop)\r\n |> filter(fn: (r) => r._measurement == \"swap\")\r\n |> filter(fn: (r) => r._field == \"total\" or r._field == \"used\")\r\n |> filter(fn: (r) => r.host == \"${Host}\")\r\n |> aggregateWindow(every: v.windowPeriod, fn: mean, createEmpty: false)\r\n |> map(fn: (r) => ({_value:r._value, _time:r._time, _field:r._field}))",
"refId": "A"
}
],
"title": "Swap",
"type": "timeseries"
}
],
"refresh": "",
"schemaVersion": 38,
"style": "dark",
"tags": [],
"templating": {
"list": [
{
"current": {
"selected": true,
"text": "influxdb",
"value": "influxdb"
},
"datasource": {
"type": "influxdb",
"uid": "a9d0fa68-f307-48dc-a1f1-4d6358dec239"
},
"definition": "import \"influxdata/influxdb/v1\"\r\nv1.tagValues(\r\n bucket: v.bucket,\r\n tag: \"host\",\r\n predicate: (r) => true,\r\n start: -1d\r\n)",
"hide": 0,
"includeAll": false,
"multi": false,
"name": "Host",
"options": [],
"query": "import \"influxdata/influxdb/v1\"\r\nv1.tagValues(\r\n bucket: v.bucket,\r\n tag: \"host\",\r\n predicate: (r) => true,\r\n start: -1d\r\n)",
"refresh": 1,
"regex": "",
"skipUrlSync": false,
"sort": 0,
"type": "query"
}
]
},
"time": {
"from": "now-1h",
"to": "now"
},
"timepicker": {},
"timezone": "",
"title": "InfluxDB System",
"uid": "ct6I5427k",
"version": 5,
"weekStart": ""
}
Useful Links
Grafana 10 and Ubuntu 22.04 Notes
There are no considerable differences to be aware of as shown and discussed in the video.