Install Telegraf and configure for InfluxDB
Video Lecture


Description
Now to install the Telegraf agent and configure the output plugin to save data into the InfluxDB2.
The installation commands for your OS are at https://portal.influxdata.com/downloads/
Note
In the video, I installed Telegraf v1.20.4 for the Ubuntu & Debian platform. I have updated the commands below for Telegraf v1.27.1.
Download the package (Telegraf v1.27.1).
wget https://dl.influxdata.com/telegraf/releases/telegraf_1.27.1-1_amd64.deb
Install it using the package manager.
sudo dpkg -i telegraf_1.27.1-1_amd64.deb
It is normally started by default. We can check its status.
sudo service telegraf status
If it isn't started, then you can start it.
sudo service telegraf start
CD into the new Telegraf folder
cd /etc/telegraf
Create a backup of the existing Telegraf config.
cp telegraf.conf telegraf.conf.bak
Delete the telegraf.conf
rm telegraf.conf
Create a new telegraf.conf
sudo nano telegraf.conf
Paste this minimal configuration text into it.
[agent]
  interval = "10s"
  round_interval = true
  metric_batch_size = 1000
  metric_buffer_limit = 10000
  collection_jitter = "0s"
  flush_interval = "10s"
  flush_jitter = "0s"
  precision = ""
  hostname = ""
  omit_hostname = false

[[outputs.influxdb_v2]]
  urls = ["http://127.0.0.1:8086"]
  token = "YOUR TELEGRAF READ/WRITE TOKEN"
  organization = "YOUR ORG NAME"
  bucket = "telegraf"

[[inputs.cpu]]
  percpu = true
  totalcpu = true
  collect_cpu_time = false
  report_active = false
[[inputs.disk]]
  ignore_fs = ["tmpfs", "devtmpfs", "devfs", "iso9660", "overlay", "aufs", "squashfs"]
[[inputs.diskio]]
[[inputs.mem]]
[[inputs.net]]
[[inputs.processes]]
[[inputs.swap]]
[[inputs.system]]
We can create one.
-
In the InfluxDB UI, Select
Telegraf, and then theCREATE CONFIGURATIONbutton. -
Choose the bucket named
Telegraf. -
Select the source
System, and then press the [CONTINUE CONFIGURING] button. -
Name your configuration
System -
Press [
SAVE AND TEST] -
Copy the token from the first command shown to you.
E.g.,
export INFLUX_TOKEN=abcdefgABCDEFG12345678abcdefhABCDFEFG123456abcdefgABCDEFG12345678abcdefhABCDFEFG123456==
Copy the part after export INFLUX_TOKEN=, so that would be
abcdefgABCDEFG12345678abcdefhABCDFEFG123456abcdefgABCDEFG12345678abcdefhABCDFEFG123456==
Replace the text YOUR TELEGRAF READ/WRITE TOKEN from the configuration above, with your new token. Your token will be different from mine.
Replace YOUR ORG NAME with the organization that you created when you first set up InfluxDB.
Press the [FINISH] button in the InfluxDB UI.
Using SSH, restart Telegraf and check its status.
sudo service telegraf restart
sudo service telegraf status
InfluxDB should now be able to query some extra metrics, and you should be able to also query them in Grafana as demonstrated in the video.
Example flux query
from(bucket: "telegraf")
  |> range(start: v.timeRangeStart, stop:v.timeRangeStop)
  |> filter(fn: (r) =>
    r._measurement == "cpu"
    and r._field == "usage_user"
  )
Grafana 10 and Ubuntu 22.04 Notes
InfluxDB 2.7.1
The UI layout, just like Grafana, changes all the time with every new version. All the same options are there, but just maybe in a different place under a different section heading.
Create the read only token
To create the Grafana_Read_only token, in InfluxDB, select API TOKENS → GENERATE API TOKEN → Custom API Token.
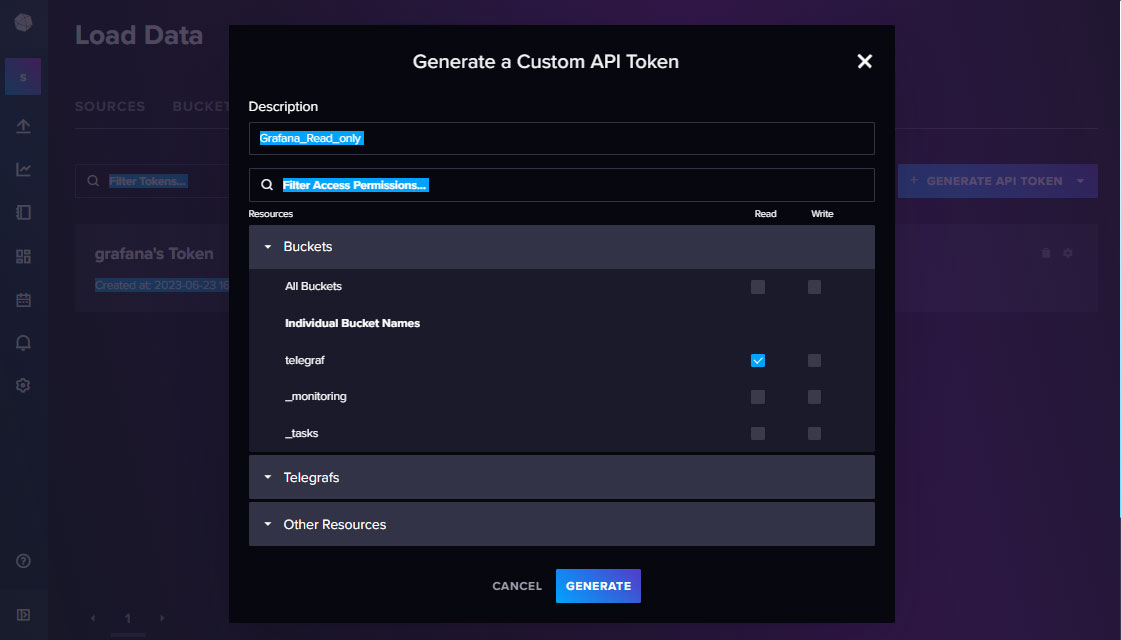
Press the [Generate] button, and save the new API token for later.
System Dashboard Missing
In InfluxDB 2.7.1, the Telegraf Configuration wizard has changed dramatically compared to InfluxDB v2.1.1. It no longer creates the System dashboard in the InfluxDB UI as shown in the video.
Instead, you can install the template from a URL.
-
In InfluxDB, press the
Dashboardsicon, and press the [CREATE DASHBOARD] button, and selectAdd a Template. -
Use this URL below in the prompt.
https://raw.githubusercontent.com/influxdata/community-templates/master/linux_system/linux_system.yml
-
Press [
LOOKUP TEMPLATE] -
Press the
Dashboardsicon gain, and the dashboard is namedLinux System