Create MySQL Data Source, Collector and Dashboard
Video Lecture


Description
In this video, I demonstrate how to set up the MySQL Data Source with a collector, and it's related dashboard.
I also demonstrate how to install a MySQL database server.
I install the MySQL database onto a new sever to also demonstrate the types of issues that you may have when connecting Grafana to another server.
Add the MySQL Data source in Grafana. If you try to save it, it will have some issues. We will next set up a MySQL server ready for the Data Source configuration.
After sourcing your new server (you can always use your existing Grafana server if you prefer) we next can install MySQL onto the new server. SSH onto your new MySQL server.
# | |
# | |
# | |
Now that we have a MySQL server, we will install a dedicated collector that will periodically gather statistics about the MySQL server and store them into a table containing rows with times and values (my2.status).
The dashboard will be the popular 2MySQL Simple Dashboard (7991) that you can download from https://grafana.com/grafana/dashboards?dataSource=mysql
The collector script that I will use can be downloaded from https://github.com/meob/my2Collector
I have MySQL 8.#.#, so I will download the file called my2_80.sql. If you have MySQL 5.#.#, then download my2.sql
SSH onto your new MySQL server and download the script using wget,
# | |
Open the script that was downloaded
# | |
Find these lines at the end of the script where it creates a specific user,
-- Use a specific user (suggested)
-- create user my2@'%' identified by 'P1e@seCh@ngeMe';
-- grant all on my2.* to my2@'%';
-- grant select on performance_schema.* to my2@'%';
uncomment and change the password to something that you think is better. E.g.,
-- Use a specific user (suggested)
create user my2@'localhost' identified by 'password';
grant all on my2.* to my2@'localhost';
grant select on performance_schema.* to my2@'localhost';
Save the changes and then run the SQL script,
# | |
Now open MySQL and do some checks.
# | |
show databases;
show variables where variable_name = 'event_scheduler';
select host, user from mysql.user;
use my2;
show tables;
select * from current;
select * from status;
quit
If when running the above lines, it shows that the event_scheduler is not enabled, then we will need to enable it so that the collector runs in the background. You can do this by editing the my.cnf file
# | |
Add lines to the end of the file
[mysqld]
event_scheduler = on
Save and restart MySQL.
# | |
The above test lines should also show a new user in the database named my2.
If everything is ok, then we can continue.
Before we can save the MySQL data source configuration in Grafana, we will need to tell it which database and user it should use. The user should be granted select permissions only since Grafana will not validate any SQL commands sent from it. We will create a specific user that can read the my2 database with select permissions only. We won't use the my2 user we created earlier since it has more permissions than our Grafana server actually needs.
Open the MySQL prompt
# | |
We need to know the IP address of our Grafana server that will initiate the connection to the MySQL server.
CREATE USER 'grafana'@'###.###.###.###' IDENTIFIED BY 'password';
GRANT SELECT ON my2.* TO 'grafana'@'###.###.###.###';
FLUSH PRIVILEGES;
quit
Note that we have now added 2 extra database users,
grafana@###.###.###.###: Used by the Grafana dashboard, to query the collected data from the MySQL server. This user has been granted the SELECT privilege only.my2@localhost: Used by the MySQL event scheduler to collect statistics and save them into the DB for use by the Grafana dashboard. This user has been granted ALL privileges.
If you installed your MySQL onto a different server, then by default it will not allow external connections.
To allow remote connections on the MySQL server.
Open the MySQL configuration file
# | |
Change the bind address to 0.0.0.0 or add this text below to the end of the file if it doesn't already exist.
[mysqld]
bind-address = 0.0.0.0
Save and restart MySQL.
# | |
Save the data source in Grafana and the connection should now be ok.
We can do a quick test using the Explore option on Grafana. Open the Explore tab, select the MySQL data source and use this query below.
SELECT
  variable_value+0 as value,
  timest as time_sec
FROM my2.status
WHERE variable_name='THREADS_CONNECTED'
ORDER BY timest ASC;
Press the [Code] button at the right, and then paste in the above sample query.
Now that we have a MySQL Data Source created, we will install a dashboard for it.
The dashboard will be the popular 2MySQL Simple Dashboard you can download from https://grafana.com/grafana/dashboards?dataSource=mysql (ID 7991)
After several hours, you should see that dashboard visualizations will fill with some data.
Connecting Grafana Cloud to MySQL using PDC.
If you are using a Grafana Cloud instance, and you want to connect to your external MySQL server, then communication will travel across the public network.
There is a lot to consider to make this communication secure, and even just to get it to work.
An easy option we have to implement this, is to setup a Private Data Source Connect (PDC) agent on our MySQL server that can manage communications between our Grafana Cloud instance, and our externally hosted MySQL server.
So to start, in the MySQL data source configuration form in your Grafana Cloud instance, enter these settings.
-
Host URL :
localhost:3306 -
Database Name :
my2
And enter some user connection details.
-
Username :
grafana -
Password :
********
When testing this connection, our MySQL server will reject the connection attempt.
Network error: Failed to connect to the server. Error message: connect: connection refused
Next thing to do is to setup a PDC agent on our MySQL server.
SSH onto your MySQL server, and CD into your usr/local/bin/ folder.
# | |
Download the latest binary that matches your operating system from https://github.com/grafana/pdc-agent/releases/
# | |
Install the tar file.
# | |
In your Grafana cloud instance, where you configure PDC connections, create a new PDC signing token.
Now we will need to create a service that keeps the PDC binary running in the background and uses this token.
# | |
Add the script and save. Note to change the **PDC start command with token** in the below script with the one shown on your Grafana Cloud instance PDC configuration page.
[Unit]
Description=Grafana Cloud PDC Agent Service
After=network.target

[Service]
Type=simple
ExecStart=/usr/local/bin/pdc-agent_Linux_x86_64/**PDC start command with token**

[Install]
WantedBy=multi-user.target
Now start and check the service is running.
# # # | |
You and also stop and restart the pdc-agent service at anytime.
# # | |
To ensure that the pdc-agent automatically starts in case of server reboot,
# | |
Try to test again, you will get a new error.
We will also need to create a user account on the mySQL server named Grafana.
Open the MySQL prompt
# | |
CREATE USER 'grafana'@'localhost' IDENTIFIED BY 'password';
GRANT SELECT ON my2.* TO 'grafana'@'localhost';
FLUSH PRIVILEGES;
quit
Try to save the data source in again and the connection should now be ok.
Now, we can do a quick test using the Explore option on Grafana. Open the Explore tab, select the MySQL data source and use this query below.
SELECT
  variable_value+0 as value,
  timest as time_sec
FROM my2.status
WHERE variable_name='THREADS_CONNECTED'
ORDER BY timest ASC;
Press the [Code] button at the right, and then paste in the above sample query.
Now that we have a MySQL Data Source created, we will install a dashboard for it.
The dashboard will be the popular 2MySQL Simple Dashboard you can download from https://grafana.com/grafana/dashboards?dataSource=mysql (ID 7991)
After several hours, you should see that dashboard visualizations will fill with some data.
Troubleshooting
ERROR : db query error: query failed
If when connecting to a MySQL data source, you see the error db query error: query failed - please inspect Grafana server log for details.
You can tail the Grafana log using the command.
# | |
Your error may be directly visible in the output of the above command, if not, try to connect again using the MySQL data sources Save & Test button, and look for the error as it is logged in real time.
If the error is similar to "Error 1045: Access denied for user 'grafana'@'[IP ADDRESS OF YOUR GRAFANA SERVER]' (using password: YES)", then you haven't added the user to MySQL correctly.
When you add the "read only" user to MySQL, you indicate which IP addresses the user is connecting from and which objects it is allowed to read.
E.g., If your Grafana servers IP Address is 10.20.30.40, and that is the IP address that the MySQL server will get the connection attempt from, then the MySQL commands to create the user and allow read on the tables are,
CREATE USER 'grafana'@'10.20.30.40' IDENTIFIED BY 'password';
GRANT SELECT ON my2.* TO 'grafana'@'10.20.30.40';
FLUSH PRIVILEGES;
If you installed MySQL locally on the same server as your Grafana server, then it would connect using localhost, so your commands would then be
CREATE USER 'grafana'@'localhost' IDENTIFIED BY 'password';
GRANT SELECT ON my2.* TO 'grafana'@'localhost';
FLUSH PRIVILEGES;
ERROR : Duplicate key name 'idx01'
If you run the my2_80.sql script twice, it will error that there is already a duplicate key idx01.
There is no reason to run the script twice, unless you have your reasons, whatever they may be.
You will need to delete the idx01, and any other objects that may have been created on the first run that now prevent the my2_80.sql script from being run twice.
Log onto the MySQL prompt
# | |
and then run these commands
use my2;
drop index idx01 on status;
drop index idx02 on current;
drop user 'my2'@'%';
quit;
And then retry
# | |
Extra Notes
MySQL Secure Installation
Note that in previous versions of this course, I would also run mysql_secure_installation. This is no longer necessary since MySQL version 8.#.# is already secured by default.
Missing Import Button
Instead of pressing a specific button for [Import] on the dashboards page, you now need to select the [New] button first, and then select the Import option.
Daemons using outdated libraries
Since Ubuntu 22.04, installing new packages may give you a full screen prompt to restart other dependent services. Press Tab to highlight the OK option, and press Enter.
Explore MySQL DataSource
Since Grafana 9, when using the Explore option on a MySQL data source, you now get a query wizard. In order to use the custom query editor instead, press the [Code] button at the right of the screen.
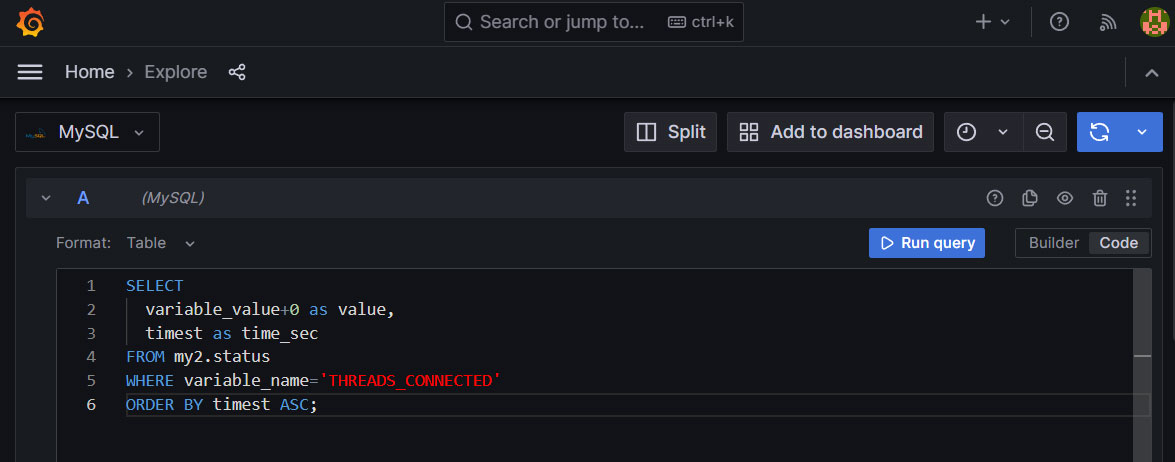
It also no longer provides an editable sample query as shown in the video. Instead, paste and run this example below.
SELECT
  variable_value+0 as value,
  timest as time_sec
FROM my2.status
WHERE variable_name='THREADS_CONNECTED'
ORDER BY timest ASC;