Graphing Non Time Series SQL Data in Grafana
Video Lecture


Description
Grafana can graph time series data from many types of data sources extremely well. But sometimes you just want to graph, simple non time series data. I.e, data without timestamps, basic tables that show simple statistics.
Example non time series data as a flat table.
| id | name | value |
|---|---|---|
| 1 | Cat | 56 |
| 2 | Dog | 35 |
| 3 | Lizard | 41 |
| 4 | Crocodile | 22 |
| 5 | Koala | 26 |
| 6 | Cassowary | 29 |
| 7 | Peacock | 19 |
| 8 | Emu | 10 |
| 9 | Kangaroo | 13 |
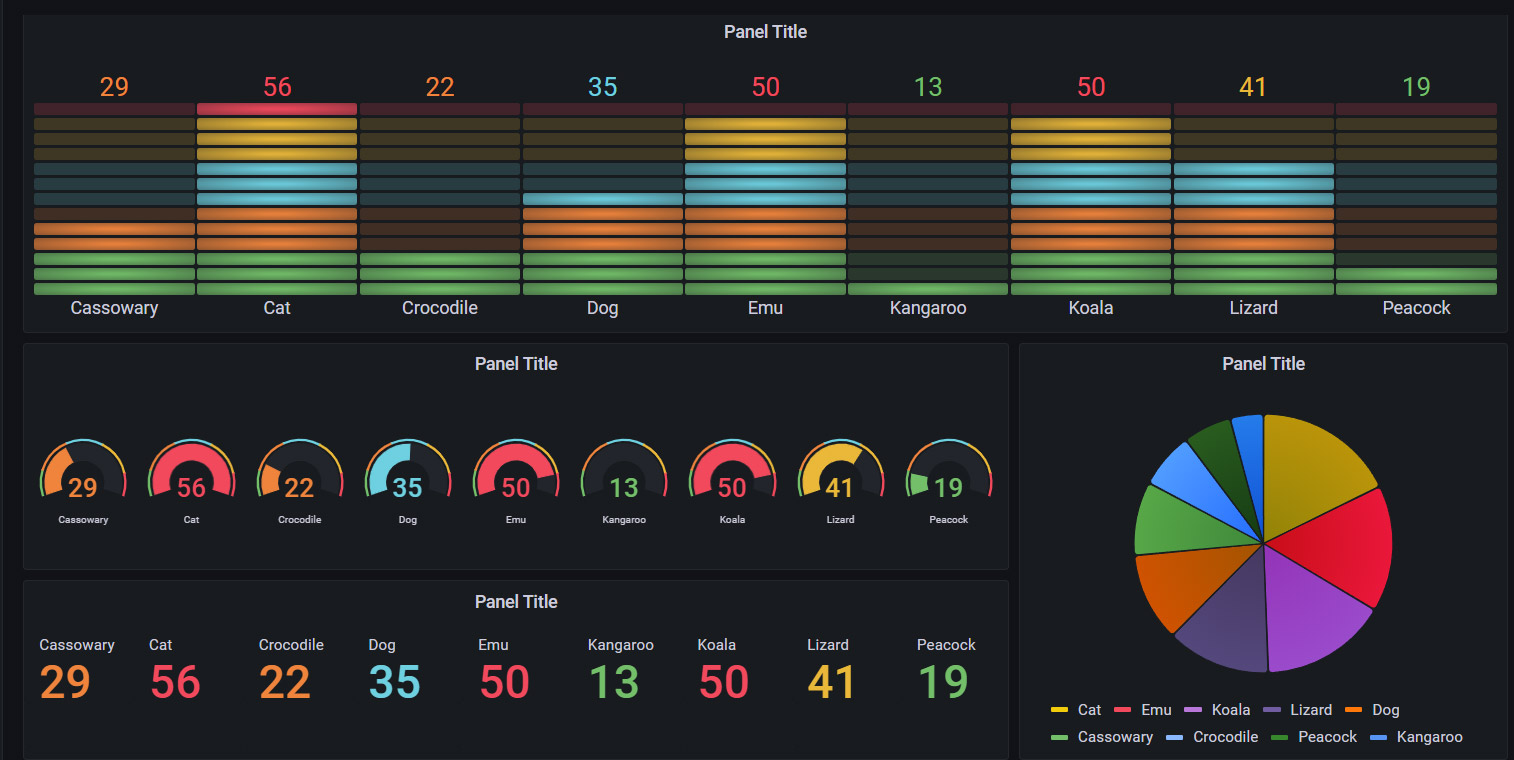
We would like to see this simple example data, as a graph similar to below.
For this exercise, we can quickly create a new database named exampledb and allow our grafana database user select permissions on it.
# | |
CREATE DATABASE exampledb;
show databases;
You should see a new database named exampledb.
Let's now create a simple table with some data that we can query.
CREATE TABLE exampledb.simple_table (
  id int(11) NOT NULL AUTO_INCREMENT,
  username varchar(45) DEFAULT NULL,
  total decimal(10,0) DEFAULT NULL,
  PRIMARY KEY (id)
);
Insert Statement
INSERT INTO exampledb.simple_table
  (username,  total)
VALUES
  ('Cat',56),
  ('Dog',35),
  ('Lizard',41),
  ('Crocodile',22),
  ('Koala',26),
  ('Cassowary',29),
  ('Peacock',19),
  ('Emu',10),
  ('Kangaroo',13);
Check data exists
SELECT * FROM exampledb.simple_table;
Explore the Data in Grafana
Open the Explore tab, select MySQL as the data source and show Code editor.
Paste in the query below.
SELECT
  username,
  total
FROM
  exampledb.simple_table
ORDER BY
  id
If you run the command, you will have an error similar to Error 1142 (42000): SELECT command denied to user 'grafana'@'###.###.###.###' for table 'simple_table'.
We should allow our grafana database user select permissions on the table.
GRANT SELECT ON exampledb.simple_table TO 'grafana'@'###.###.###.###';
FLUSH PRIVILEGES;
quit;
Now try to connect from Grafana again.
Convert Query to return a Time Series
Now convert it to a time series by aliasing NOW() as "time".
SELECT
  NOW() as "time",
  username,
  total as ""
FROM
  exampledb.simple_table
ORDER BY
  id
You can test updating the data in the table, and seeing it in Grafana by opening your MySQL prompt and executing,
UPDATE exampledb.simple_table SET total = 50 WHERE username = 'Koala';