Create and Configure a Zabbix Data Source
Video Lecture


Description
You can connect directly to Zabbix via the API method.
Your Zabbix servers API endpoint may resemble,
https://example.com/zabbix/api_jsonrpc.php
You will also need to configure a specific user account in the Zabbix UI, that Grafana can use when connecting. The user should have permission to access the API.
If you want faster performance than it is advised to also setup a MySQL data source for your Zabbix connection. The MySQL data source will instead connect directly to the Zabbix database and bypass the API layer for certain queries.
Create Zabbix Specific MySQL Data Source
We can create a MySQL Data Source that will connect directly to the Zabbix Servers MySQL Database. This is useful if you want to improve performance.
SSH onto the Zabbix Server,
Create a user in MySQL, with read only access, that the Grafana MySQL data source will use to connect with.
mysql
> CREATE USER 'grafana'@'GRAFANA SERVER IP ADDRESS' IDENTIFIED BY 'password';

> GRANT SELECT ON zabbix.* TO 'grafana'@'GRAFANA SERVER IP ADDRESS';

> FLUSH PRIVILEGES;

> select host, user from mysql.user;

> QUIT;
Also allow remote connections on MySQL
sudo nano /etc/mysql/my.cnf
Change or Add the bind address value to the end of the file.
[mysqld]
bind-address    = 0.0.0.0
Restart MySQL
Restart the MySQL and check the status.
sudo service mysql restart
sudo service mysql status
I then go back into Grafana, finish and save the MySQL data source for Zabbix.
Install Zabbix Data Source Plugin
Now it's time to install the Zabbix Data Source plugin that will connect to the Zabbix API, and also use the new MySQL data source we just created.
It is easiest to use the Grafana UI to install the Zabbix data source plugin and set it up. You can also do it manually by continuing to use the methods below which is more useful for older versions of Grafana.
SSH onto the Grafana Server and add the Zabbix Data Source plugin using the CLI
grafana-cli plugins install alexanderzobnin-zabbix-app
Since Grafana v7, unsigned plugins won't be visible unless you explicitly allow them in the Grafana.ini file.
Open /etc/grafana/grafana.ini, and uncomment the line
;allow_loading_unsigned_plugins
and change to
allow_loading_unsigned_plugins = alexanderzobnin-zabbix-datasource
And then restart the Grafana server
sudo service grafana-server restart
I then use the Grafana UI to enable the Zabbix Data Source Plugin, and then configure it.
The required API URL will be,
https://[your zabbix server ip or domain name]/zabbix/api_jsonrpc.php
Also select the 'Direct DB Access' to be the new MySQL data source you just created.
Save and Continue
Troubleshooting
If you upgraded to Grafana 8.3, then the Zabbix query editor options may disappear and stop working.
The steps to get it working again are,
-
Delete your Zabbix data source using
Grafana UI --> Configuration --> Data Sources -
Disable and uninstall the Zabbix plugin using
Grafana UI --> Configuration --> Plugins -
SSH onto your server and restart the Grafana service.
sudo service grafana-server restart
-
Re-install the Zabbix plugin using
Grafana UI --> Configuration --> Plugins -
Enable plugin using
Grafana UI --> Configuration --> Plugins -
Recreate the Zabbix data source using
Grafana UI --> Configuration --> Data Sources -
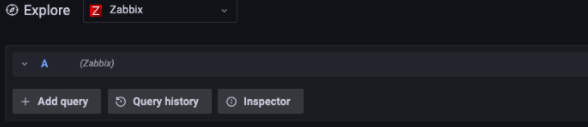
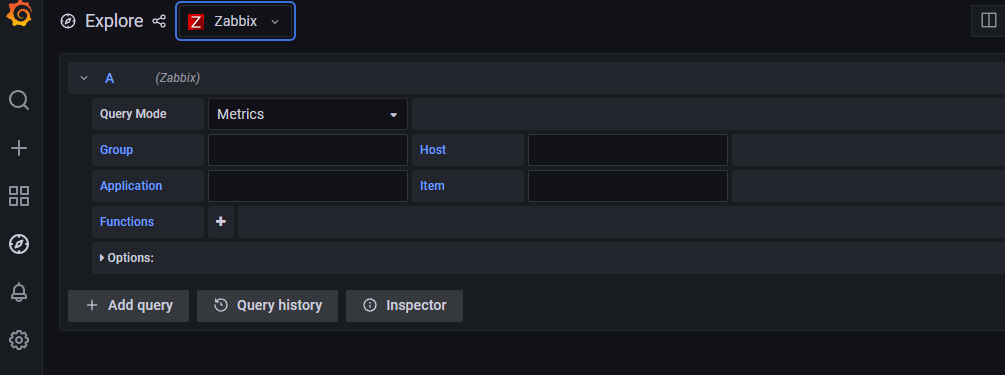
Visit the
Grafana UI --> Exploretab using Grafana UI
Zabbix Course
If you want to try a more detailed course on Zabbix, then you can visit my Zabbix tutorials.