Create First Data Source
Video Lecture


-->
Description
Grafana allows you to query, visualize, alert on and understand your metrics no matter where they are stored.
Setting up data sources is a very skilled process which requires a lot of understanding about the the underlying data source.
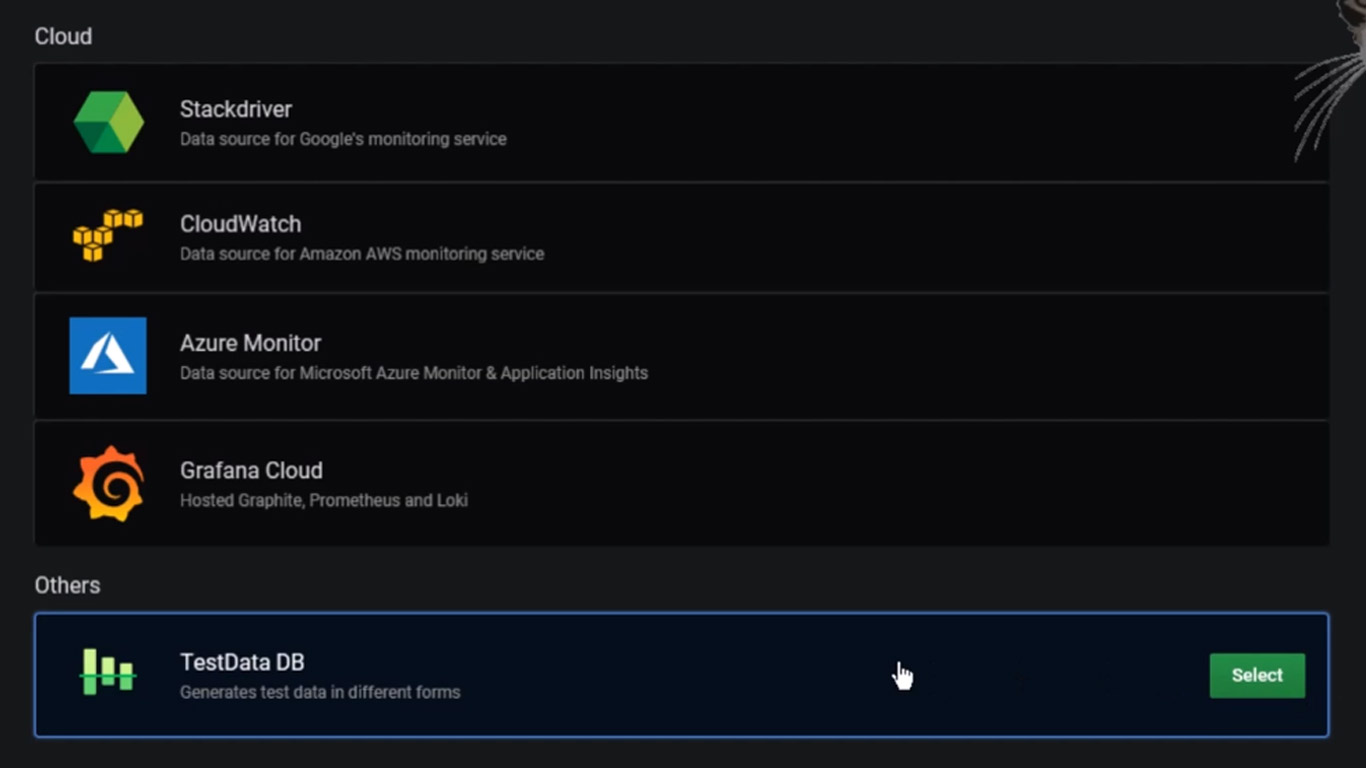
So while learning, to make it much easier to begin with, we can use a mock data source called TestData.
Grafana Cloud
Note that this course is predominantly about installing and managing Grafana OSS (Open Source). But this course also has some content demonstrating how to setup your own Grafana Cloud instance as well.
Grafana Cloud is a managed service where you can subscribe to certain levels of support. This may be a more suitable approach for your corporation long term rather than building and managing your own Grafana server manually as I show in this course.
While it is important to know the inner details of managing your own Grafana server, it can later be more strategic for your business to outsource the many aspects of it.
So, when that time comes, use my link here, Grafana Cloud, and you will receive 28 days of PRO trial rather than the default 14 days.
Benefits,
- Upgraded 28-day trial to Grafana Pro (vs. the standard 14-days)
- 3 users
- 10k metrics
- 50GB logs
- 50GB traces
- Automatic updates
- 30 notifications for OnCall
- 14-day retention
Sign up at Grafana Cloud