Grafana Agent Flow
Description
These are my logs from experimenting setting up Grafana Agent Flow v0.36 on Ubuntu 22.04.
Note
Grafana Agent Flow, just like Grafana, is changing all the time. So this information will be very quickly out of date.
Instead of installing both Promtail and Prometheus Node Exporter on a Linux host in order to monitor logs and metrics, you can install one component called Grafana Agent Flow and that will perform both tasks.
You can configure it to send to your exiting Loki server and to push metrics to a Prometheus remote write endpoint.
Visit https://grafana.com/docs/agent/latest/flow/setup/install/linux/ for the latest install instructions.
However, the commands I used are below.
-
Import the GPG key and add the Grafana package repository.
sudo mkdir -p /etc/apt/keyrings/ wget -q -O - https://apt.grafana.com/gpg.key | gpg --dearmor | sudo tee /etc/apt/keyrings/grafana.gpg > /dev/null echo "deb [signed-by=/etc/apt/keyrings/grafana.gpg] https://apt.grafana.com stable main" | sudo tee /etc/apt/sources.list.d/grafana.list -
Update the repositories.
sudo apt-get update -
Install Grafana Agent.
sudo apt-get install grafana-agent-flow -
You will also need a configuration file.
You can find a configuration generator at https://grafana.github.io/agent-configurator/
You can then paste the generated code into,
sudo nano /etc/grafana-agent-flow.riverInstead, after some experiments, I ended up creating the sample below. You will need to replace the
http://prometheus:9090andhttp://loki:3100with the correct URLs of your own Prometheus and Loki servers.prometheus.remote_write "local" { endpoint { url = "http://prometheus:9090/api/v1/write" } } prometheus.scrape "linux_node" { targets = prometheus.exporter.unix.targets forward_to = [ prometheus.remote_write.local.receiver, ] } prometheus.exporter.unix { } loki.write "local" { endpoint { url = "http://loki:3100/loki/api/v1/push" } } loki.relabel "journal" { forward_to = [] rule { source_labels = ["__journal__systemd_unit"] target_label = "unit" } } loki.source.journal "read" { forward_to = [ loki.write.local.receiver, ] relabel_rules = loki.relabel.journal.rules labels = { "job" = "my_job", } } -
Start Grafana Agent Flow
sudo service grafana-agent-flow start -
Your Prometheus server will need to have remote write enabled so that the Grafana Agent Flow can push data to it.
SSH onto your Prometheus server and edit the file
sudo nano /etc/default/prometheusAnd enable the
remote writefeature by adding it to theARGSvariableARGS="--web.enable-remote-write-receiver"If you have Prometheus version 2.33.2 or earlier, then it will break your config, so use this below instead,
ARGS="--enable-feature=remote-write-receiver" -
Restart Prometheus and check status.
sudo service prometheus restart sudo service prometheus status -
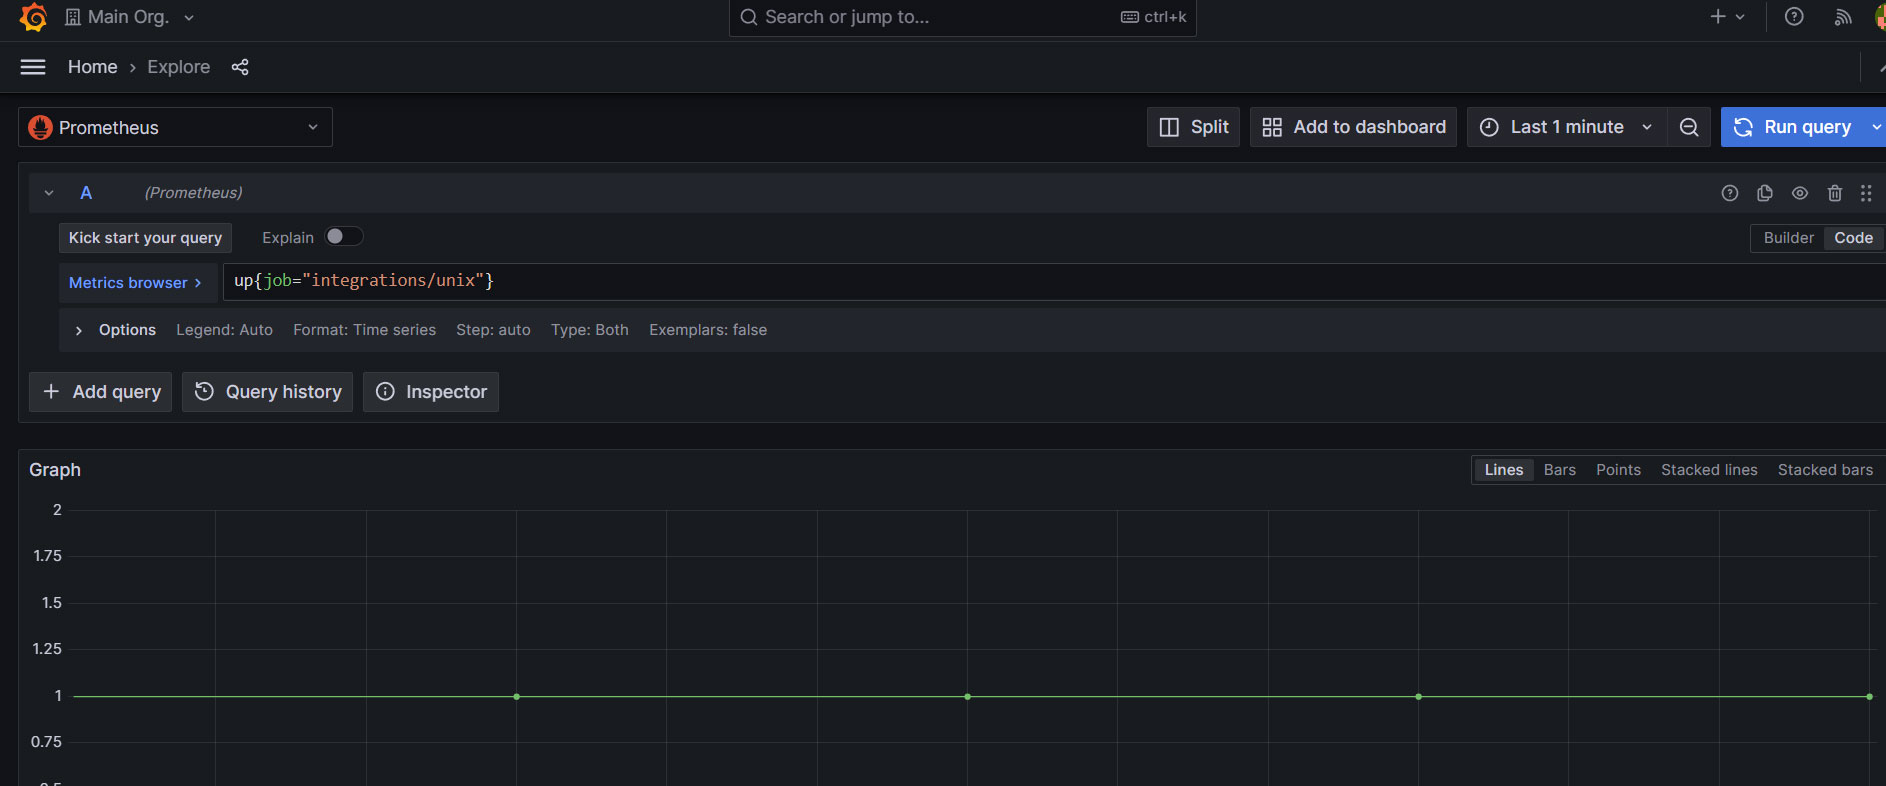
Open Grafana and Explore.
If you have successfully setup Loki and Prometheus on your Grafana server, then you can find Prometheus metrics using the Prometheus data source and under
job="integrations/unix"and the journal logs under the Loki data source and underjob="my_job".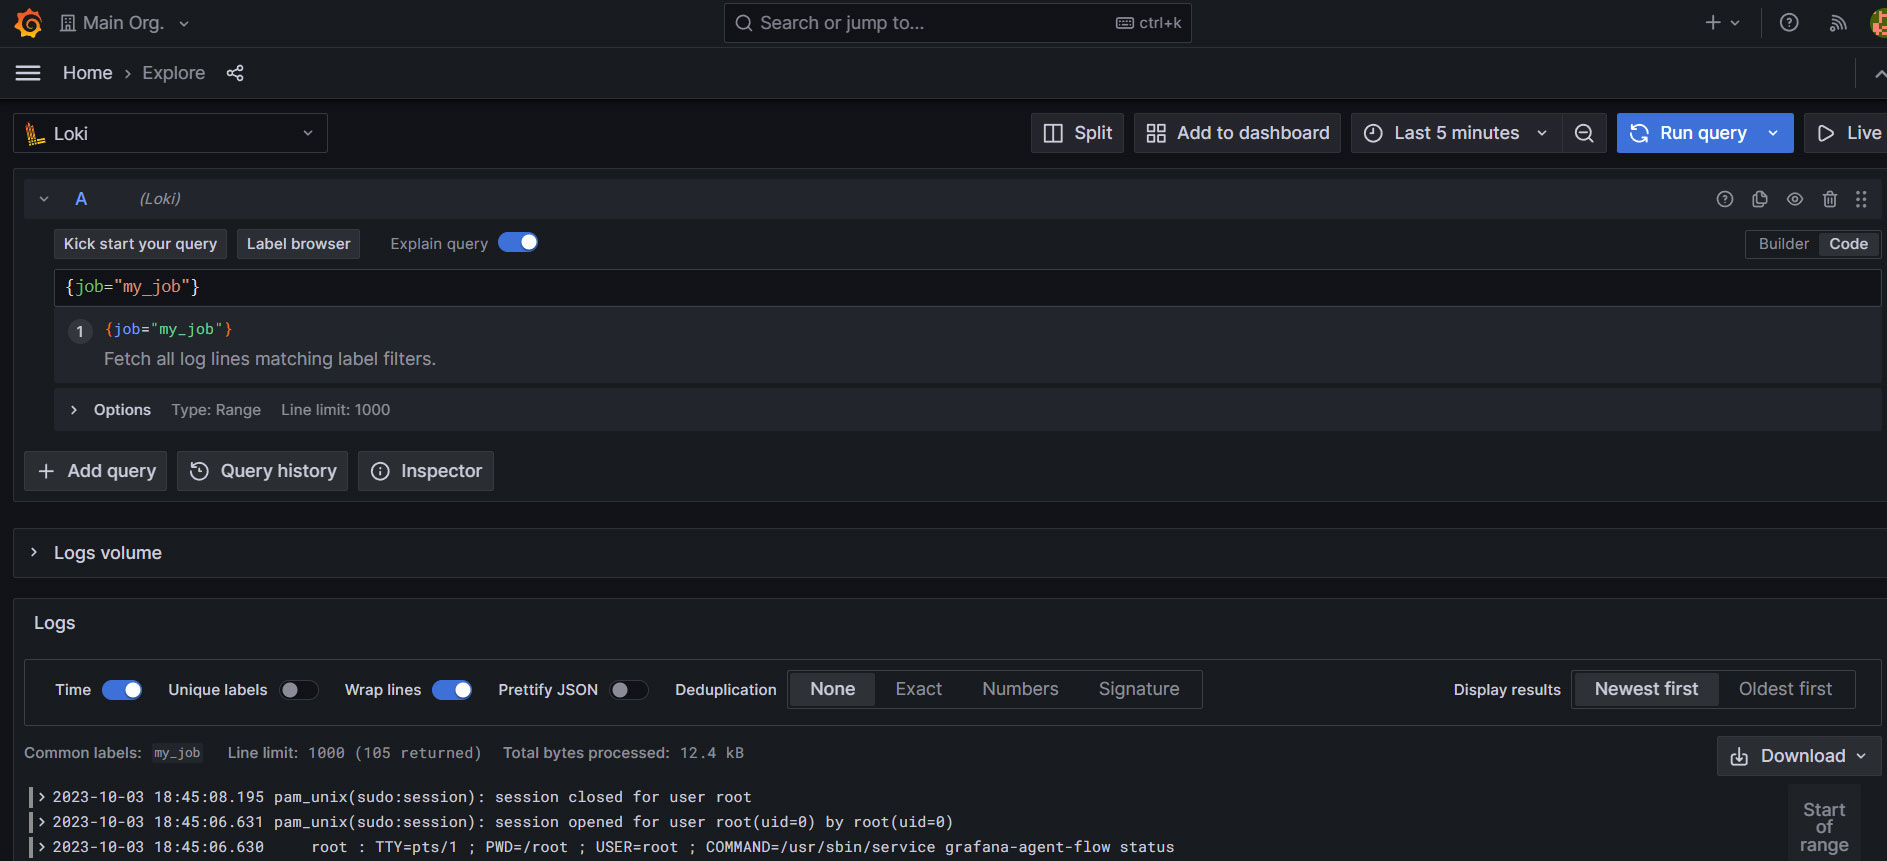
If things are not working for you, then you may have to manage your firewalls to allow the Grafana Agent Flow to push data to both your Loki and Prometheus servers.