Install Prometheus Dashboard
Video Lecture


Description
We will install two dashboards being one for the Prometheus service and the other for the Node Exporter.
The Prometheus dashboard can be found in the dashboards tab for the Prometheus data source configuration in the Grafana UI.
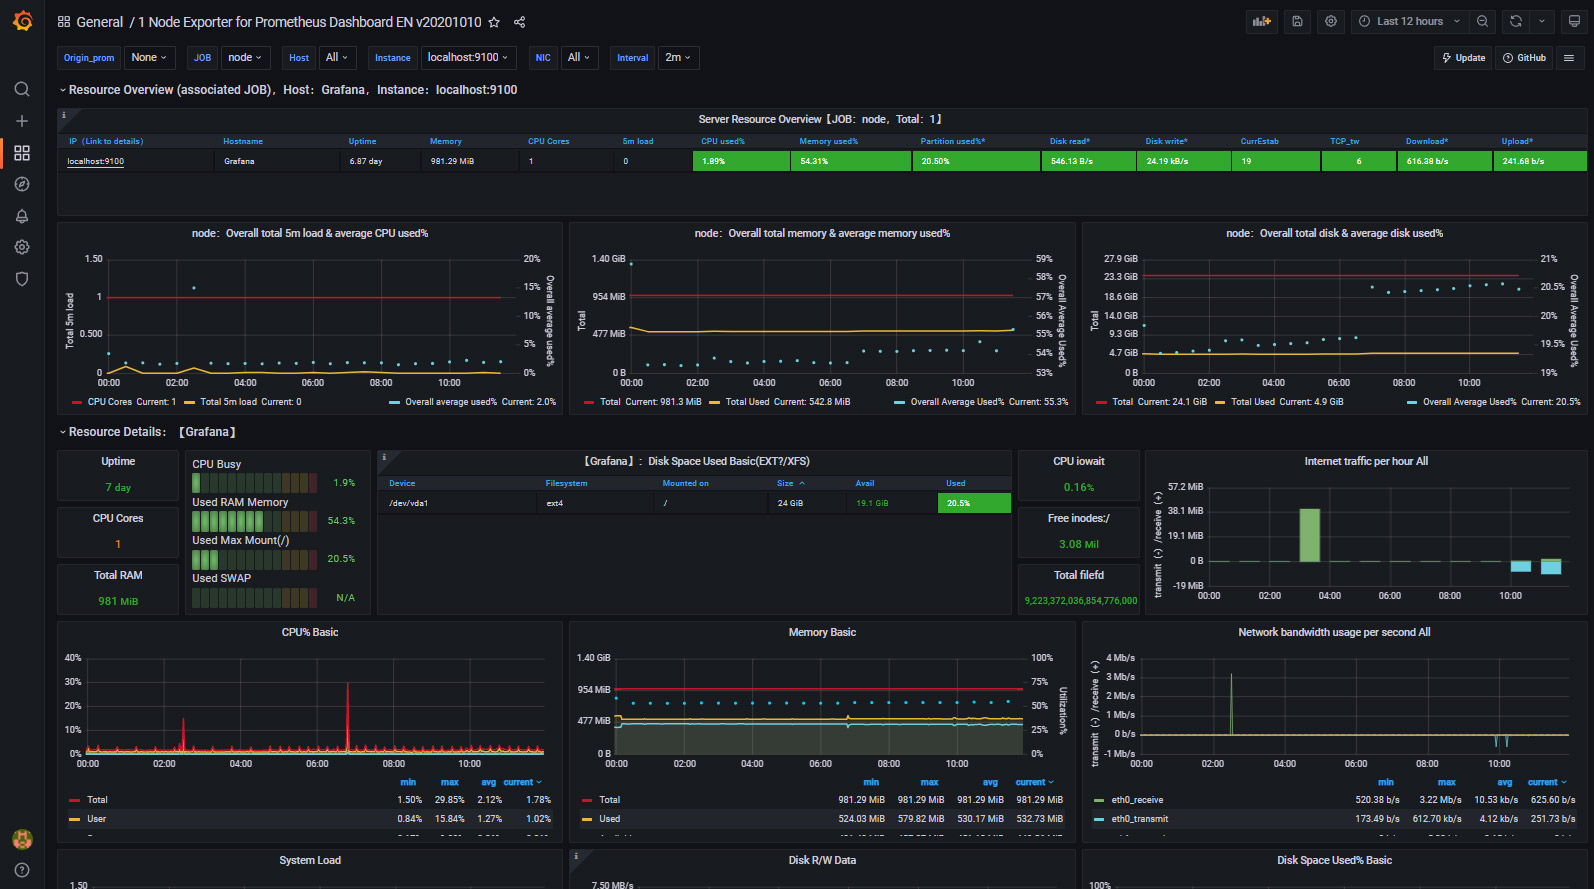
We will get the Node Exporter dashboard from the official Grafana Dashboards link.
https://grafana.com/grafana/dashboards
The dashboard ID is 11074 for the English version or ID 8919 for the Chinese version.
English Version: https://grafana.com/grafana/dashboards/11074
Chinese Version: https://grafana.com/grafana/dashboards/8919
Prometheus Course
If you want to try a more detailed course on Prometheus, then you can visit my Prometheus tutorials.