Annotation Queries Linking the Log and Graph Panels
Video Lecture


Description
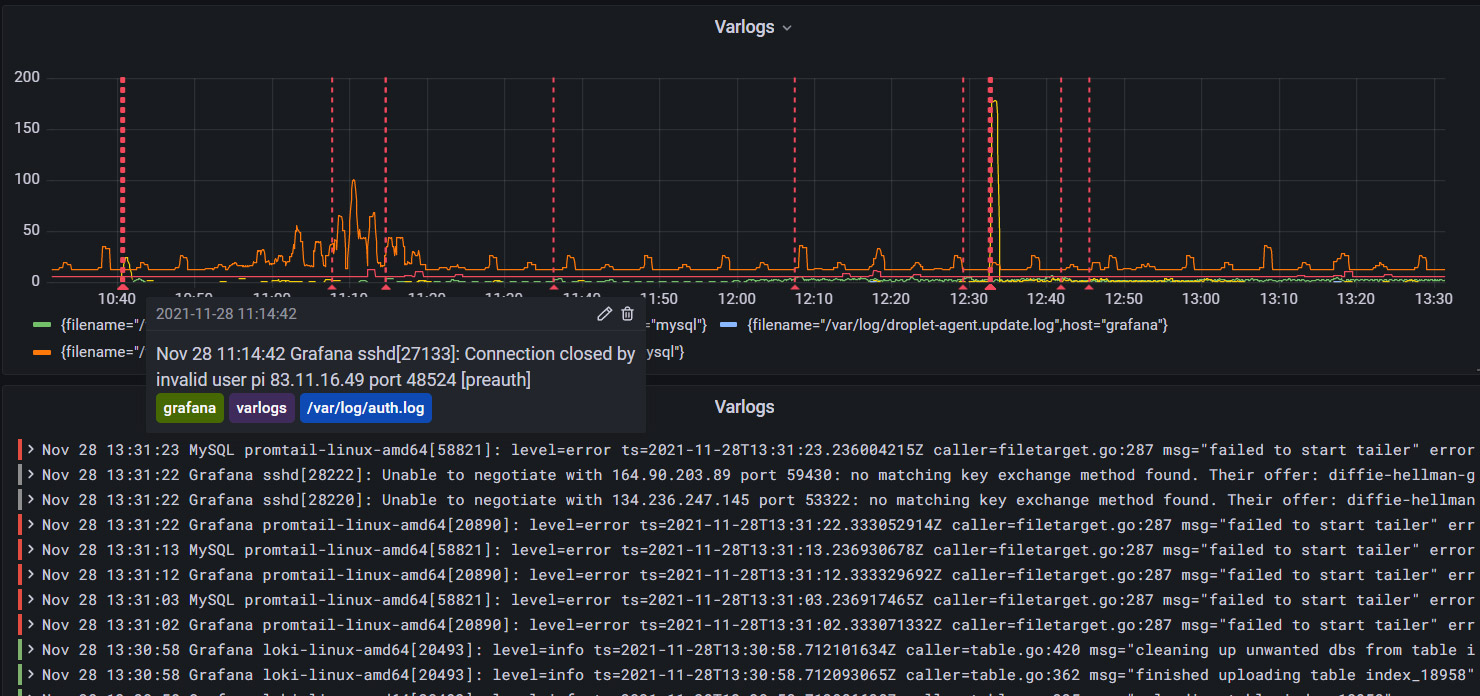
In this video, I demonstrate setting up annotation queries to help me visualize invalid user login attempts on my servers.
The queries I demonstrated in this video were
{filename="/var/log/auth.log"}
count_over_time({filename="/var/log/auth.log"}[1m])
count_over_time({filename="/var/log/auth.log"}[$__auto])
sum(count_over_time({filename="/var/log/auth.log"}[$__auto])) by (host)
The annotation query I demonstrated in this video was,
{filename="/var/log/auth.log"} |= "invalid user"